
Training zones from your own test, not a formula
Nine free calculators built by the HP3 coaching team. Each one turns a field test you can do this week into the paces, powers, heart rates, lifting loads and fuelling targets we prescribe to the athletes we coach.
A calculator is only as good as the test behind it. HP3 is a team of chartered physiotherapists and coaches, so every tool here tells you how to run the test properly, what the number can and cannot tell you, and which published method it comes from. The methods and the papers are listed further down this page.
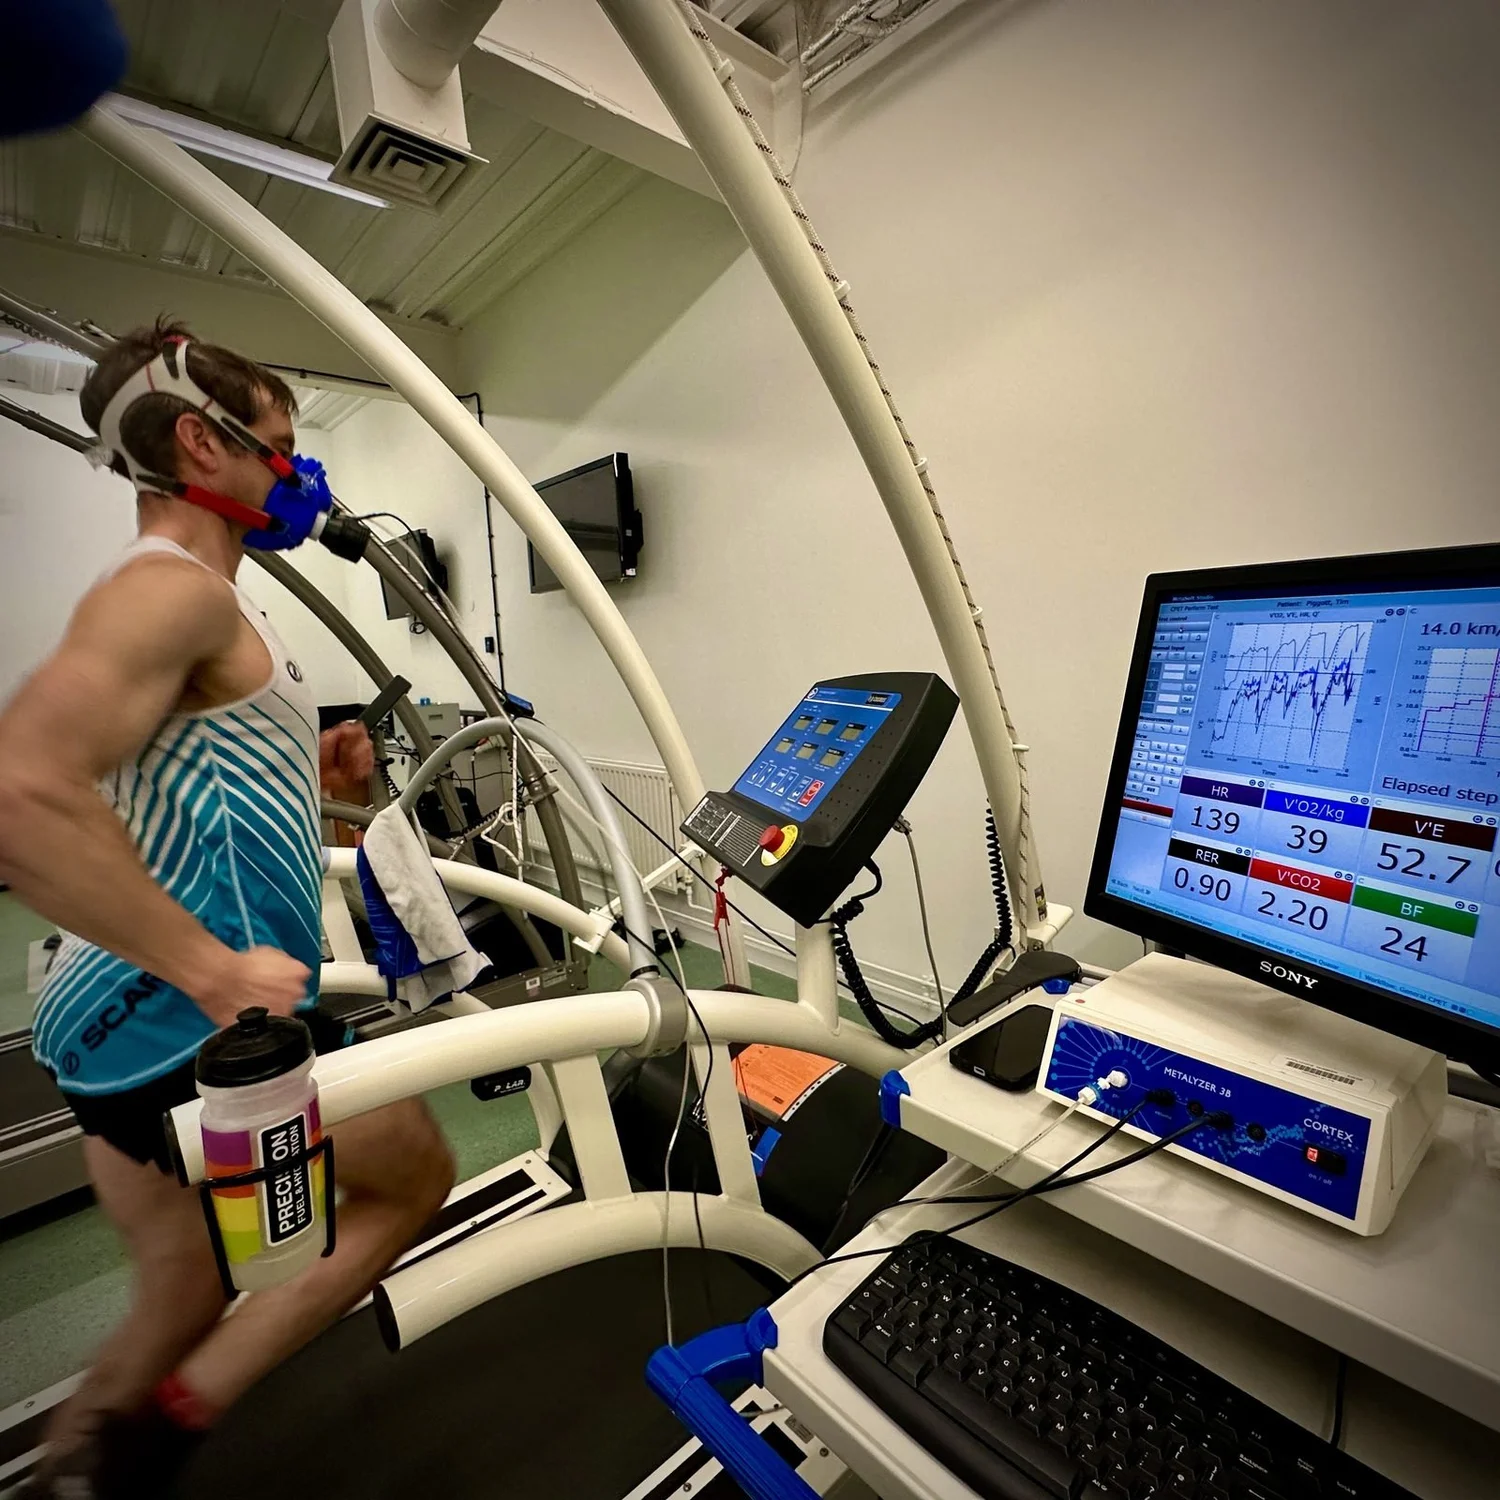
Test it, then train to it
Every zone on this page is a percentage of a threshold you measured yourself. That is the point of the tests: a number from your own body on a given day, rather than a chart built from someone else’s age or a race you have not run yet. It is also the limit of the tests, and we would rather tell you that here than let you find out in a session.
Field tests stand in for the lab
Lactate threshold is measured with blood samples on a treadmill or ergometer. For most athletes that is neither practical nor necessary. A 30-minute all-out run estimates both the speed and the heart rate at threshold closely enough to prescribe training from, and 95 per cent of a 20-minute cycling effort is a valid field marker of threshold power in trained riders.
McGehee et al. 2005, J Strength Cond Res; Valenzuela et al. 2018, Int J Sports Physiol Perform.
Zones move, so re-test
Each calculator anchors its zones to the threshold you enter. Train well for a block and the threshold rises; get ill, injured or take a break and it falls. The zones only stay honest if the number behind them is current, so repeat the test when your fitness changes and re-enter the result. Coached HP3 athletes have this built into their plan.
Honest about the error
Field estimates work on average, not perfectly for everyone. In trained cyclists, 95 per cent of 20-minute power matched true hour power as a group, yet an individual rider could be 40 to 60 watts out either way. Treat your zones as a well-founded starting point, watch how sessions feel against them, and adjust. That judgement is what a coach adds.
Borszcz et al. 2018, Int J Sports Med.
Nine tools, one place
Five set training zones for swimming, cycling and running. One sets your lifting loads. Three plan fuelling and hydration. Each opens on its own page with the test protocol, how to read the result and the references, so you can check our working.

Critical swim speed (CSS)
You need: your best 400 m and 200 m times from one session. Returns your CSS pace and five pace zones.
Open the calculator
Functional threshold power (FTP)
You need: average power from a 20-minute test, or from both efforts of a 2 x 8-minute test. Returns FTP and five power zones.
Open the calculator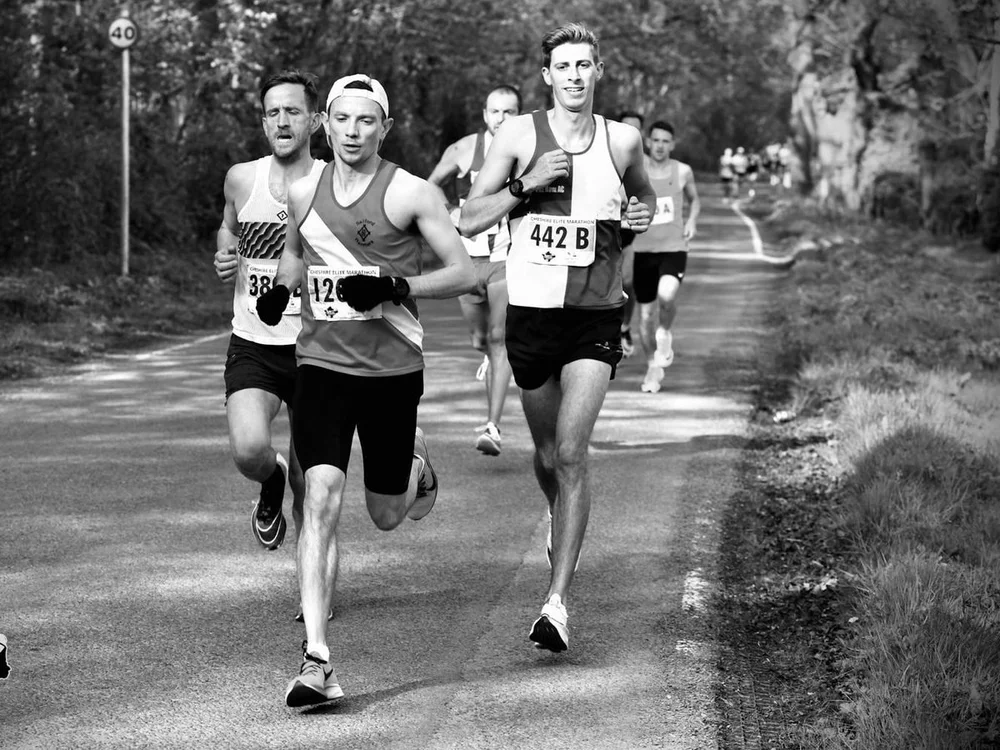
Threshold pace
You need: average pace from a 30-minute time trial, or a recent 5 km or 10 km race. Returns pace zones per mile or per kilometre.
Open the calculator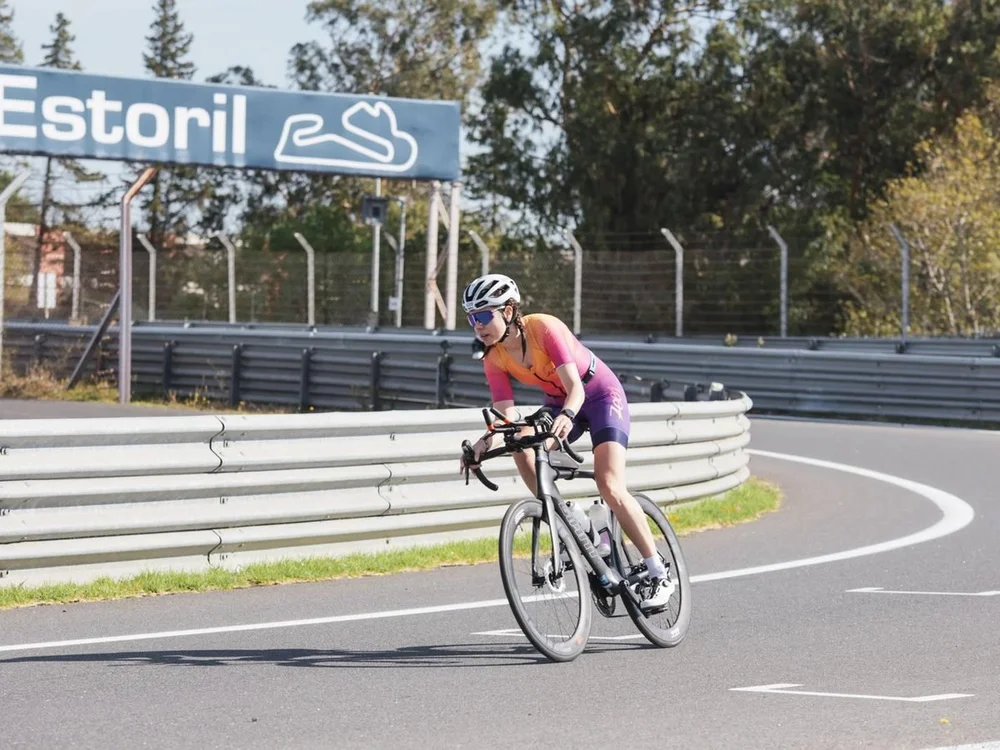
Threshold heart rate, bike
You need: average heart rate from a 20-minute maximal ride. Returns heart-rate zones for the bike.
Open the calculator
Threshold heart rate, run
You need: average heart rate from the final 20 minutes of a 30-minute maximal run. Returns heart-rate zones for running.
Open the calculator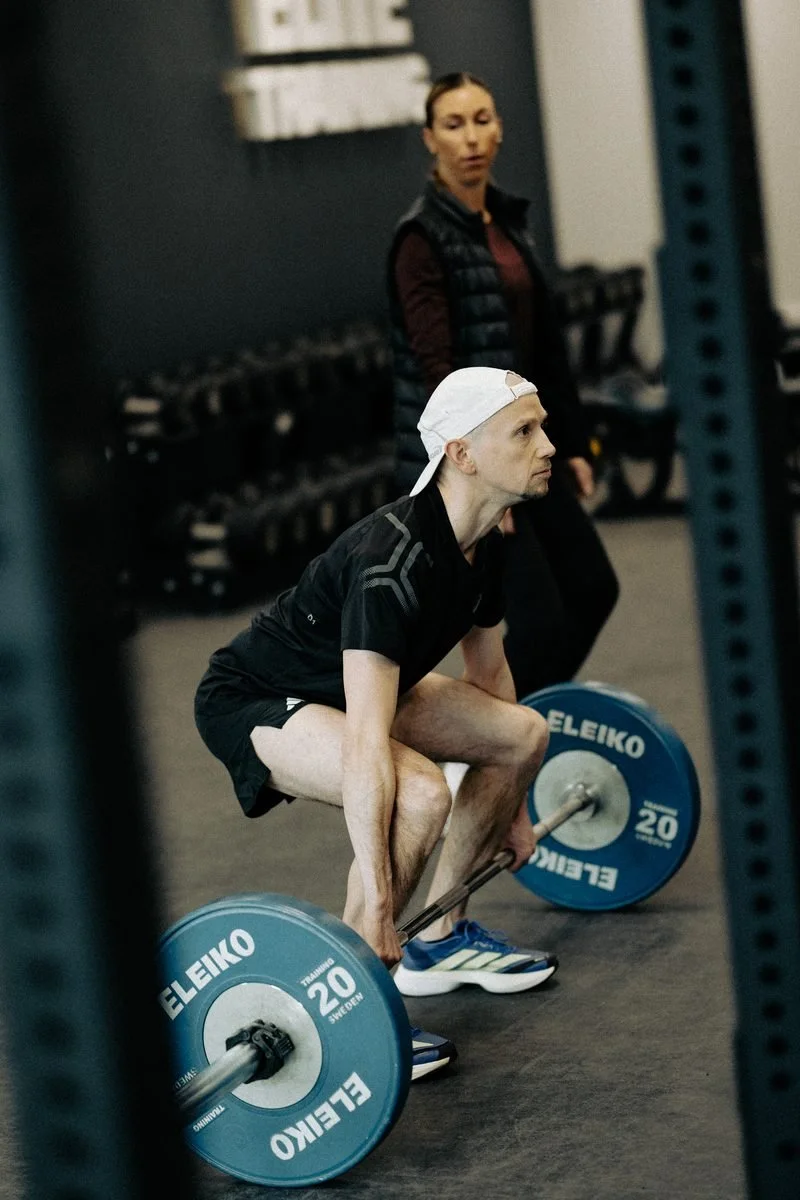
One-repetition maximum (1RM)
You need: a weight you lifted and the reps completed to failure (1 to 10). Returns an estimated 1RM and loads at 50 to 90 per cent.
Open the calculator
Ultramarathon nutrition plan
You need: body mass, start time, expected duration and your planned hourly intakes. Returns an hour-by-hour plan for a single-stage ultra.
Open the calculator
Carbohydrate fuelling
You need: body mass, session length and intensity, what you ate, and any gut symptoms. Returns an hourly carbohydrate target and a tolerance log.
Open the calculator
Sweat rate and hydration
You need: body mass before and after a session, fluid drunk, duration and conditions. Returns sweat rate in litres per hour and a fluid plan.
Open the calculatorThe calculators are free to use and nothing is stored. They give general training guidance, not medical advice: if you have a heart condition, are returning from illness or injury, or are unsure whether a maximal test is safe for you, speak to a clinician first. Our physiotherapists can assess that as part of coaching.
Methods you can check
Each calculator uses a published protocol or a published equation, chosen by the HP3 coaching team because it has been tested against laboratory measures in athletes. The summaries below say what each tool does and where the method comes from. The full references are at the foot of this section, with a link to every paper.
Critical swim speed
CSS is the slope of the line between two all-out swims, here 400 m and 200 m: the pace the distance-time relationship says you could hold for a long time. It correlates closely with the speed at which blood lactate starts to accumulate, and swimming a little below it produces a steady lactate response. At CSS itself continuous effort is limited to around 20 to 25 minutes, which is why the zones put threshold sets just under it.
Wakayoshi et al. 1992; Dekerle et al. 2010.
Functional threshold power
FTP is Coggan’s estimate of the power you can hold for about an hour, taken as 95 per cent of a 20-minute test. The calculator also accepts a 2 x 8-minute test at 90 per cent of the mean. The 20-minute method is a valid field marker of threshold in trained cyclists; it tends to underestimate threshold in less-trained riders, and individual error is wide, so zones are a starting point to refine.
Borszcz et al. 2018; Valenzuela et al. 2018.
Threshold pace and heart rate
Both run calculators use a 30-minute maximal time trial: the average pace for the whole effort, and the average heart rate for the final 20 minutes. In competitive runners and triathletes that test estimated both the speed and the heart rate at the lactate threshold without a significant difference from blood-lactate measurement. The bike heart-rate tool applies the same logic to a 20-minute ride.
McGehee et al. 2005; protocol after Friel.
One-repetition maximum
Rather than lift a true maximum, you lift a lighter load to failure and the calculator predicts 1RM with the Epley or Brzycki equation. Repetition-maximum testing predicts 1RM accurately provided the set is 10 reps or fewer, which is why the tool caps the input at 10. The loads it then lists at 50 to 90 per cent are the ranges we programme from in strength sessions.
Reynolds et al. 2006; Brzycki 1993.
Carbohydrate and ultramarathon planning
The carbohydrate tool gives an hourly target for your session and logs gut symptoms against it, because tolerance can be trained and the gut should be prepared for what race day will ask of it. The ultramarathon planner follows the International Society of Sports Nutrition position stand for single-stage ultras: 150 to 400 kcal, 30 to 50 g of carbohydrate and 5 to 10 g of protein per hour, with 450 to 750 ml of fluid.
Jeukendrup 2014, 2017; Tiller et al. 2019.
Sweat rate
Weighing yourself before and after a session, corrected for what you drank, is the simplest and most accurate way to measure whole-body sweat rate. Sweat rate and sweat sodium vary widely between athletes and within the same athlete across intensity, heat and acclimatisation, which is why a measured rate beats a generic drinking plan, and why it is worth repeating in different conditions.
Baker 2017.
References
Every paper below was checked against its publisher record before it was listed. Sample sizes are small in some of the swimming and cycling studies, so treat the field tests as validated approximations rather than laboratory measurements.
- Wakayoshi K et al. 1992. Determination and validity of critical velocity as an index of swimming performance in the competitive swimmerEuropean Journal of Applied Physiology 64(2):153-157
- Dekerle J et al. 2010. Characterising the slope of the distance-time relationship in swimmingJournal of Science and Medicine in Sport 13(3):365-370
- Borszcz FK et al. 2018. Functional threshold power in cyclists: validity of the concept and physiological responsesInternational Journal of Sports Medicine 39(10):737-742
- Valenzuela PL et al. 2018. Is the functional threshold power a valid surrogate of the lactate threshold?International Journal of Sports Physiology and Performance 13(10):1293-1298
- McGehee JC, Tanner CJ, Houmard JA. 2005. A comparison of methods for estimating the lactate thresholdJournal of Strength and Conditioning Research 19(3):553-558
- Reynolds JM, Gordon TJ, Robergs RA. 2006. Prediction of one repetition maximum strength from multiple repetition maximum testing and anthropometryJournal of Strength and Conditioning Research 20(3):584-592
- Brzycki M. 1993. Strength testing: predicting a one-rep max from reps-to-fatigueJournal of Physical Education, Recreation and Dance 64(1):88-90
- Jeukendrup A. 2014. A step towards personalized sports nutrition: carbohydrate intake during exerciseSports Medicine 44(Suppl 1):S25-S33
- Jeukendrup AE. 2017. Training the gut for athletesSports Medicine 47(Suppl 1):101-110
- Tiller NB et al. 2019. International Society of Sports Nutrition position stand: nutritional considerations for single-stage ultra-marathon training and racingJournal of the International Society of Sports Nutrition 16:50
- Baker LB. 2017. Sweating rate and sweat sodium concentration in athletes: a review of methodology and intra/interindividual variabilitySports Medicine 47(Suppl 1):111-128
Put your zones to work
A threshold is only useful once it shapes a session. These free resources from the HP3 team show how we build training, fuelling and strength work around the numbers the calculators give you.
Fuel and hydrate
Train and lift
The numbers are the start. Coaching is what you do with them.
A calculator gives you a threshold. A coach decides how much time to spend at each zone, when to re-test, and what to change when the plan meets real life, injury or illness. At HP3 that decision is made by a team of coaches and chartered physiotherapists working from your data, so the assessment is built into the plan rather than added on.
Not ready for coaching? Join the TeamHP3 community and ask the coaches about your numbers there.

Training zones - Swim Pace CSS

Training Zones - Bike Power

Training Zones - Run Pace

Training Zones - Bike Heart Rate

Training Zones - Run Threshold Heart Rate

Strength training calculator

Ultramarathon Nutrition Planning Calculator

Carbohydrate Fuelling Calculator
